Adam Osterholzer: adam.osterholzer@colostate.edu,
970-222-9568
Dr. Punya Nachappa: Punya.Nachappa@colostate.edu,
785-383-4873
Visit our website at: https://www.csuwheatentomology.com/.
Wheat Stem Sawfly State-Wide Results
A statewide survey of WSS infestation has been conducted since 2013 to determine the scope of infestation across the state. Several sites are surveyed each year post-harvest, with the number of sites collected per county being proportional to the amount of wheat grown within them. Collection sites are wheat fields directly adjacent to the previous year’s stubble. Sites are a minimum of 10 miles apart. For each site surveyed, 100 tillers are collected and dissected to check for the presence of WSS larvae. The percentage of infested tillers is reported for each location. Low infestation sites have less than 10% of total tillers with WSS infestation. Medium sites have between 10%-50%, and high sites have greater than 50% infestation.
The percentage of infested sites has increased over the years (Table 1). The ratio of sites with medium (10%-50%) and high infestation (>50%) levels has also grown over this period. In 2023, the average infestation was 14.31% whereas in 2024 the average infestation doubled at 27.39%. The high levels of precipitation in 2023 are the suspected cause of this reduced infestation. The WSS infestation increased across most of the counties surveyed except for Baca, Boulder, Cheyenne and Weld counties. Weld county had a drastic reduction in WSS infestation in 2024, but the reason for the decrease is not known (Table 2).
In 2024, 17 out of our 69 total sites had high infestation, while a further 19 had moderate infestation. We saw significant southern expansion past the I-70 corridor (Figure 1). Further movement was observed to the east, as well as in Kansas.
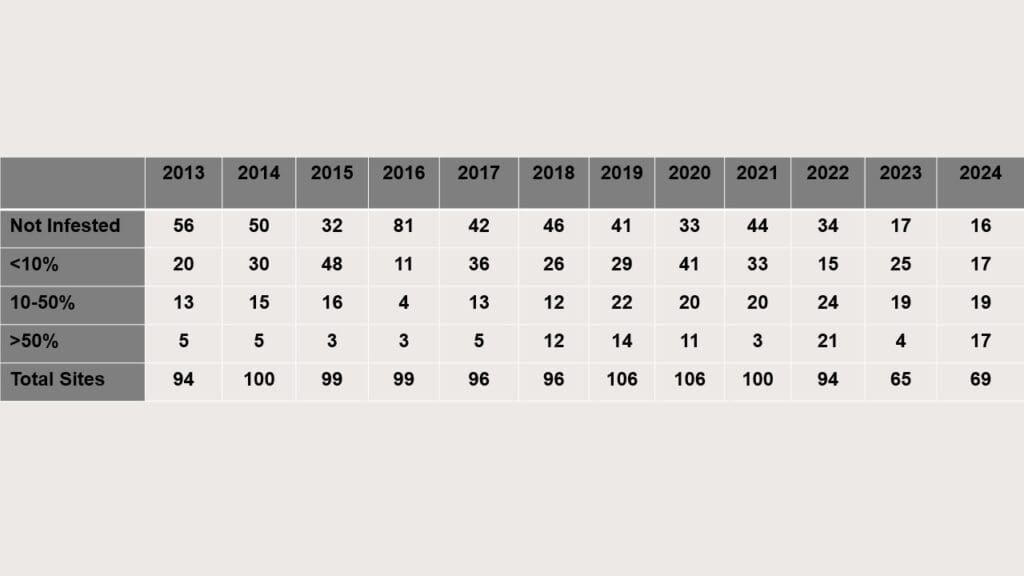
Table 1: Number of Colorado wheat fields in each WSS infestation category from 2013-2024.
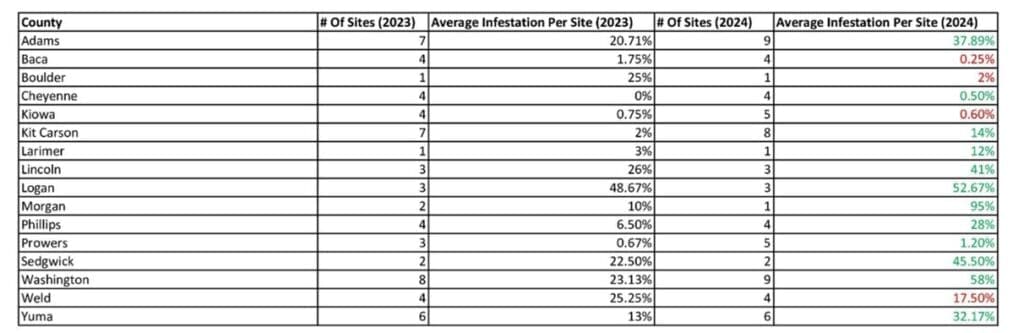
Table 2: 2024 WSS infestation averages by county. Counties with increased infestation in 2024 have green values, while ones with decreased infestation have red values.
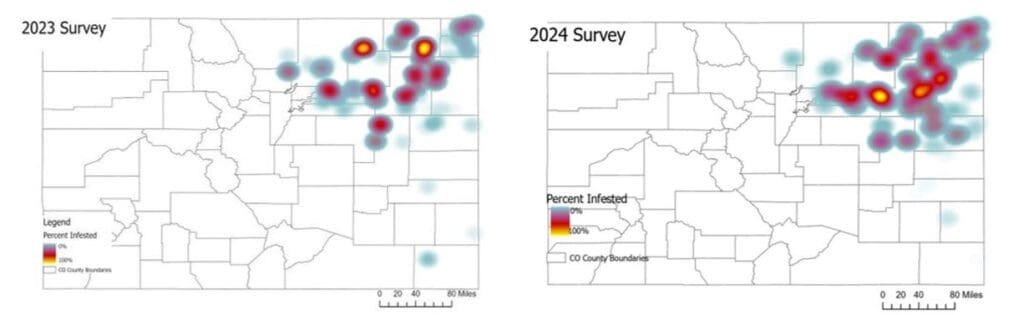
Figure 1: Heat map depicting percentage WSS infestation in 2023 and 2024 observed during the state-wide survey.
Acknowledgements
We would further like to acknowledge the wheat growers of Colorado and the Colorado Wheat Administrative Committee for funding.